Radial
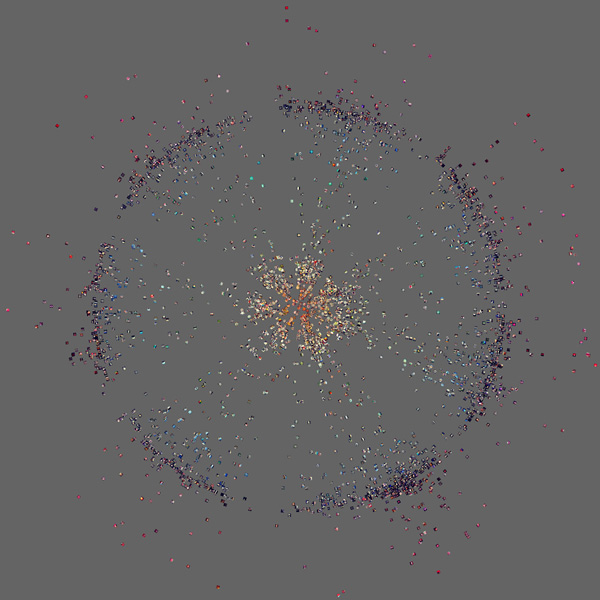
Our Radial visualizations place photos along a circle using upload dates, geographic coordinates, or visual attributes. One parameter controls the angle (position along the perimeter); another parameter controls the radius (how far a photo is from the center). These compact visualization forms enable us to explore the data on multiple dimensions, presenting, for example, the images organized by their visual attribute (hue, brightness, texture, etc.) and by when and where they were taken – all in a singular visualization. Radial visualizations are particularly useful for studying temporal changes (time is mapped into angle).

50,000 photos from Tel Aviv, organized by hue mean (radius) and hue median

33,292 photos from tel-aviv, April 20-26, 2012, sorted by hue (Radius) and time

Instagram images shared in Centre Pompidou in Paris, sorted by brightness mean and contrast

120,000 Instagram images shared in six cites (New York, London, Tokyo, Moscow, Bangkok, Sao Paolo) during one week, sorted by average hue and sharing day and time.

11,758 photos from tel-aviv, April 25-26, 2012, sorted by time and location (Radius)
33,292 photos from tel-aviv, April 20-26, 2012, sorted by Instagram filters