This summer we received a commission to create new artworks to be shown during Google Zeitgeist 2014 conference. The
conference is an invitation only two day event; this year it took place during September 14-16
in Paradise Valley, Arizona.
Google produced high quality video of many of the presentations.
(You can also find videos of the talks from the earlier conferences at www.zeitgeistminds.com). For me personally,
the highlights were the talks of Presidents Carter and Clinton, Google's own Eric Schmidt and
Larry Page, and Lawrence Lessig - and also chatting with the people from Google X who were showing their amazing
research.
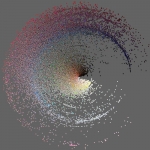
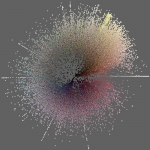
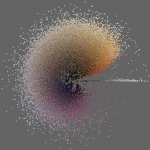
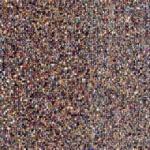
We were asked to create animated versions of our Phototrails project. In the original project, we
analyzed and visualized 2.3 million Instagram photos from 13 global cities. For the new Google
Zeitgeist project, we created a number of new still visualizations using our our ImagePlot tool. We also used
the animation option in ImagePlot to render a long sequence of visualization frames. The frames
were rendered in 4K and then scaled to HD resolution. We used Premiere and After Effects to
assemble the videos.
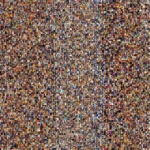
The two final videos which were exhibited at the conference are above. The fist video dissolves
between both original and new Phototrails visualizations. The second is a slow zoom into the
animated visualization of 120,000 Instagram photos from 6 cities. (Note: because of the Vimeo
compression, the videos do not look as sharp as the originals).
The project was created by the original Phototrails
team: Nadav Hochman, Jay Chow and Lev Manovich.
During the weeks leading to the event, we collaborated using Dropbox because each of us was in a
different place: Nadav in NYC, Jay in California, and I was first in Brazil and then in Ireland.
After we saw our videos playing at the site the morning of September 14th, we went back to the
hotel, made some adjustments and rendered new versions. Good thing that ImagePlot (originally
written by Manovich in 2010, and later expanded by Chow) kept rendering and never quit - even in
Arizona's heat!
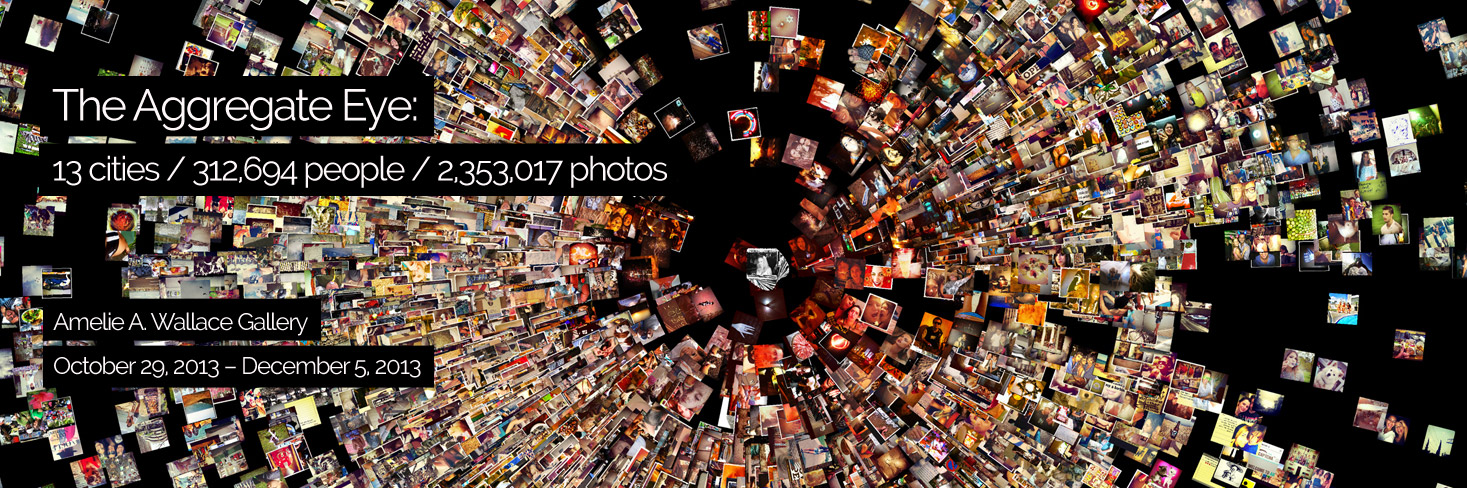
Nadav Hochman, Lev Manovich, Jay Chow The Aggregate Eye: 13 cities / 312,694 people / 2,353,017 photos “The Aggregate Eye turns a spotlight onto the world of social photography, raising a
whole new generation of questions concerning art and its place in society.” Paul Longo, Musee Magazine “A genius new exhibition… examines the patterns created by our ever-increasing output
onto social media.” Dale Eisinger, Complex October 29 – December 5, 2013 Lecture by Lev Manovich: ”From Atget to Instagram: Representing the City” Curated by Hyewon Yi and Alise Tifentale Maps, photographs, and cinema are the principal technologies that individuals, small
groups, and businesses traditionally have used to represent cities. Today, urban
representations can be created by hundreds of millions of ordinary people who capture
and share photos on social networks. If we were to aggregate these masses of photos, how
would our cities look? How unique are the photos captured by each of us? Are there
dominant themes regardless of location? The Aggregate Eye, a project created by Nadav Hochman, Lev Manovich, and Jay
Chow, investigates these questions. The collaborators downloaded and analyzed 2,353,017
Instagram photos shared by 312,694 people in thirteen cities over a three-month period.
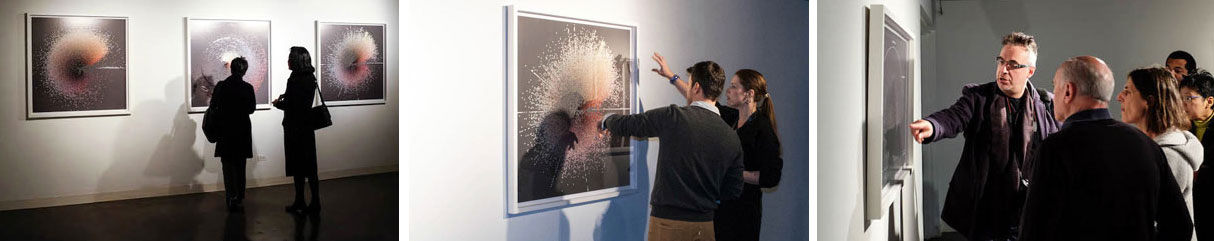
The large prints and video included in the exhibition combine these photos to reveal
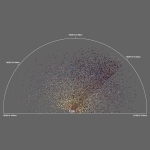
unique patterns. One set of images compares New York, Tokyo, and Bangkok using 150,00
Instagram photos. Another image, created by 53,498 photos taken in Tokyo over several
days, depicts a gradual progression from day to night activities. A visualization of
23,581 photos shared in Brooklyn during Hurricane Sandy captures the dramatic narrative
of that day. This exhibition is a part of the Phototrails project, initiated by Hochman, Manovich, and
Chow to investigate patterns in social media user-generated photography and video. The
Atlantic Cities, Der Spiegel, The Guardian, and Wired have reported on the project.
Amelie A. Wallace Gallery Exhibition walkthroughs with gallery director Hyewon Yi: Gallery contact: Hyewon Yi <yih@oldwestbury.edu>
Project Exhibitions
Google Zeitgeist 2014 conference
The Aggregate Eye: 13 cities / 312,694 people / 2,353,017 photos
Opening reception: October 29, 4 – 7pm
Followed by panel discussion with Lev Manovich, Nadav Hochman, Alise Tifentale,
and Hyewon Yi
October 29, 7 – 8pm
SUNY College at Old Westbury, Old Westbury, New York 11568
Directions: www.oldwestbury.
Hours: Monday - Thursday, 12 – 5pm, and by appointment
Monday, November 11, 1pm and Wednesday, December 4, 11am